
Purchase your Stata Prof+ Plan License Upgrade here, with rapid downloads sent directly to your inbox.
Complete Your Order Here
Complete Your Order Here
Choose the number of licenses, license term and the product you are after and add to basket.
£10.00
Ex. VAT
We may be able to offer bespoke pricing. Contact us to discuss your requirements.
Navigate to 'compare versions' below to discover more about each flavour of Stata. Still need help? Contact us to discuss your requirements.
The Stata Prof+ Plan grants reduced pricing to faculty and staff at all degree-granting institutions. Ensure if you're eligible? Contact us to discuss your requirements.
Compare Stata
Stata is a complete, integrated software package that provides all your data science needs—data manipulation, visualization, statistics, and automated reporting. Stata is not sold in modules, which means you get everything you need in one package.
Whether you're a student or a seasoned research professional, a range of Stata packages are available and designed to suit all needs.
All of the following editions of Stata have the same complete set of commands and features and manuals included as PDF documentation within Stata.

Stata/MP is the fastest and largest edition of Stata. Virtually any current computer can take advantage of the advanced multiprocessing of Stata/MP. This includes the Intel i3, i5, i7, i9, Xeon, and Celeron, and AMD multi-core chips. On dual-core chips, Stata/MP runs 40% faster overall and 72% faster where it matters, on the time-consuming estimation commands. With more than two cores or processors, Stata/MP is even faster.
Stata/MP is faster-much faster. Stata/MP lets you analyze data in one-half to two-thirds of the time compared to Stata/SE on inexpensive dual-core laptops and in one-quarter to one-half the time on quad-core desktops and laptops.
Stata/MP runs even faster on multiprocessor servers. Stata/MP supports up to 64 processors/cores.
Speed is often most crucial when performing computationally intense estimation procedures. A few of Stata's estimation procedures, including linear regression, are nearly perfectly parallelized, meaning they run twice as fast on two cores, four times as fast on four cores, eight times as fast on eight cores, and so on. Some estimation commands can be parallelized more than others. Taken at the median, estimation commands run 1.8 times faster on 2 cores, 2.9 times faster on 4 cores, and 4.1 times faster on 8 cores.
Stata/MP is 100% compatible other editions of Stata. Analyses do not have to be reformulated or modified in any way to obtain Stata/MP’s speed improvements.
Stata/MP is available for the following operating systems:
- Windows (64-bit processors);
- macOS (64-bit Intel processors);
- Linux (64-bit processors);
To run Stata/MP, you can use a desktop computer with a dual-core or quad-core processor, or you can use a server with multiple processors. Whether a computer has separate processors or one processor with multiple cores makes no difference. More processors or cores makes Stata/MP run faster.
For more advice on purchasing/upgrading to Stata/MP or for hardware queries, please contact our sales team.

Stata/SE and Stata/BE differ only in the dataset size that each can analyse. Stata/SE and Stata/MP can fit models with more independent variables than Stata/BE (up to 65,532). Stata/SE can analyse up to 2 billion observations.

Stata/BE allows datasets with as many as 2,048 variables. The maximum number of observations is 2.14 billion. Stata/BE can have at most 798 independent variables in a model.
| Product Features | Stata/BE | Stata/SE | Stata/MP |
|---|---|---|---|
| Maximum number of variables |
 |
 |
|
| Maximum number of independent variables |
|
|
|
| Multicore support |
|
|
|
| Time to run logistic regression with 10 million observations and 20 covariates |
|
|
|
| Complete suite of statistical features |
|
|
|
| Publication-quality graphics |
|
|
|
| Matrix programming language |
|
|
|
| Complete PDF documentation |
|
|
|
| Exceptional technical support |
|
|
|
| Includes within-release updates |
|
|
|
| 64-bit version available |
|
|
|
| Windows, Mac, or Unix |
|
|
|
| Memory Requirements |
|
|
|
| Disk space requirements | 1 GB | 2 GB | 4 GB |
| Disk space requirements | 2 GB | 2 GB | 2 GB |
Whats new in Stata 18
Take your research further with the newest features in Stata 18.
Stata 18 has something for everyone. Below we list the highlights of this release. Stata 18 is unique because most of the new features can be used by researchers in every discipline.
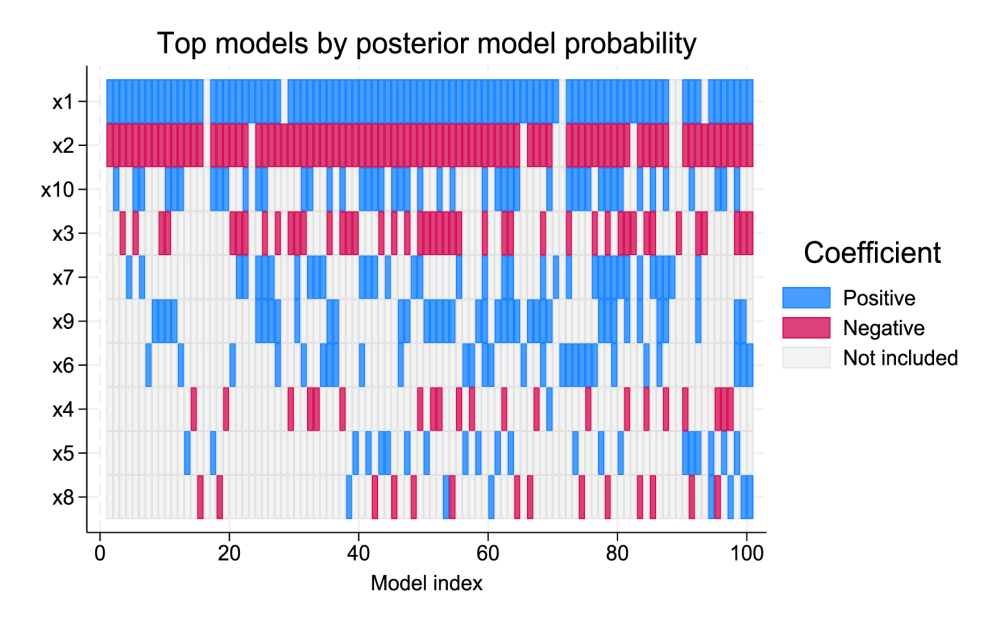
Bayesian model averaging (BMA)
Uncertain which predictors to use in your regression?
Use Bayesian model averaging to account for this uncertainty in your analysis. Explore influential models and predictors, obtain better predictions, and more.
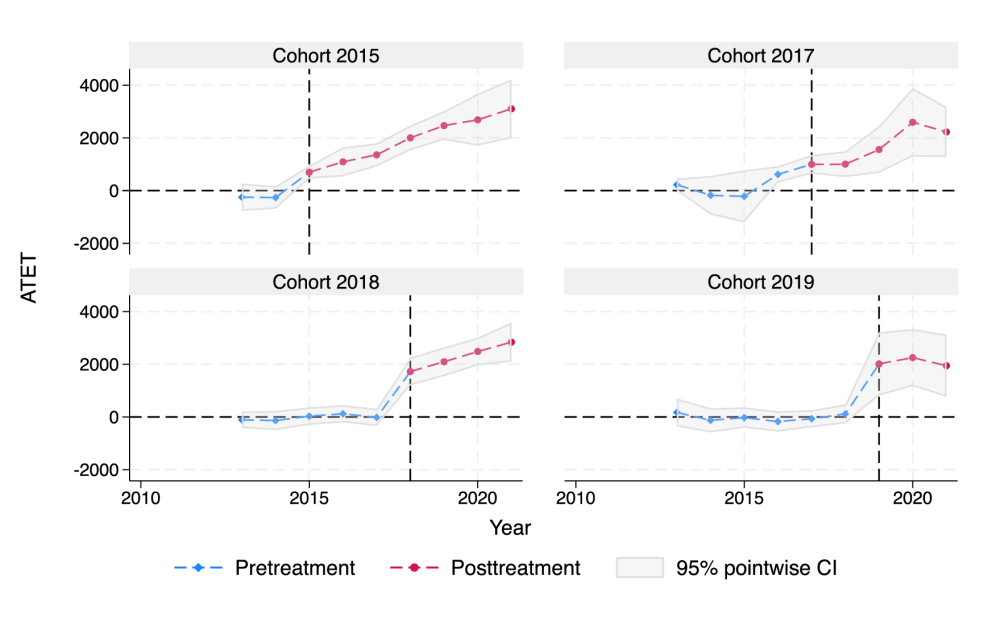
Heterogeneous DID
Estimate treatment effects that vary over groups and time. Fit models for repeated cross-sectional or panel data.
Visualize effects. Aggregate effects within group, time, or exposure to treatment.
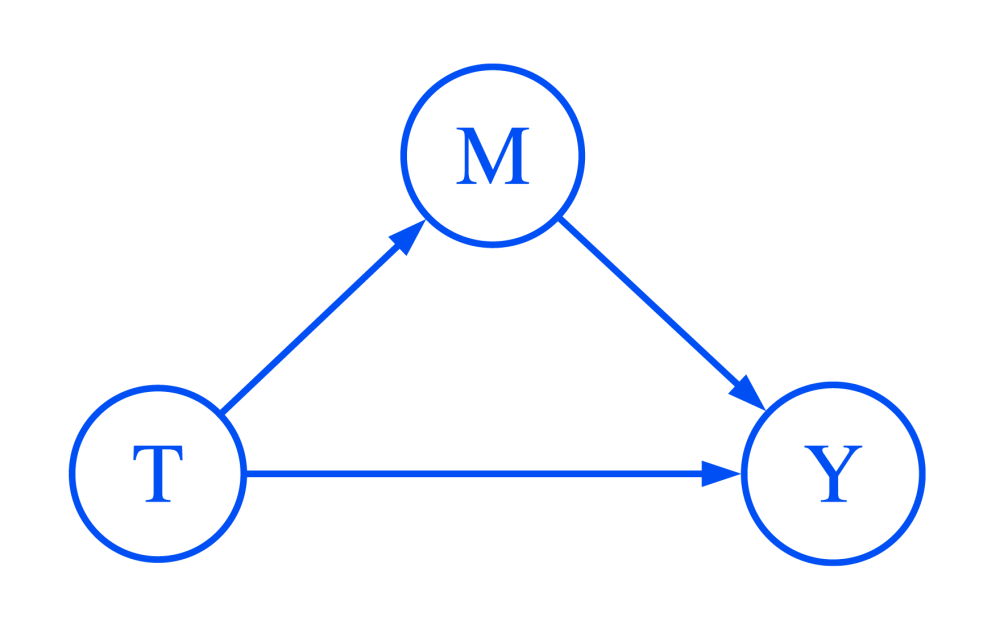
Causal mediation analysis
Causal analysis quantifies causal effects. Causal mediation analysis disentangles them.
Are these effects mediated through another variable? Estimate direct and indirect effects. Calculate the proportion mediated.
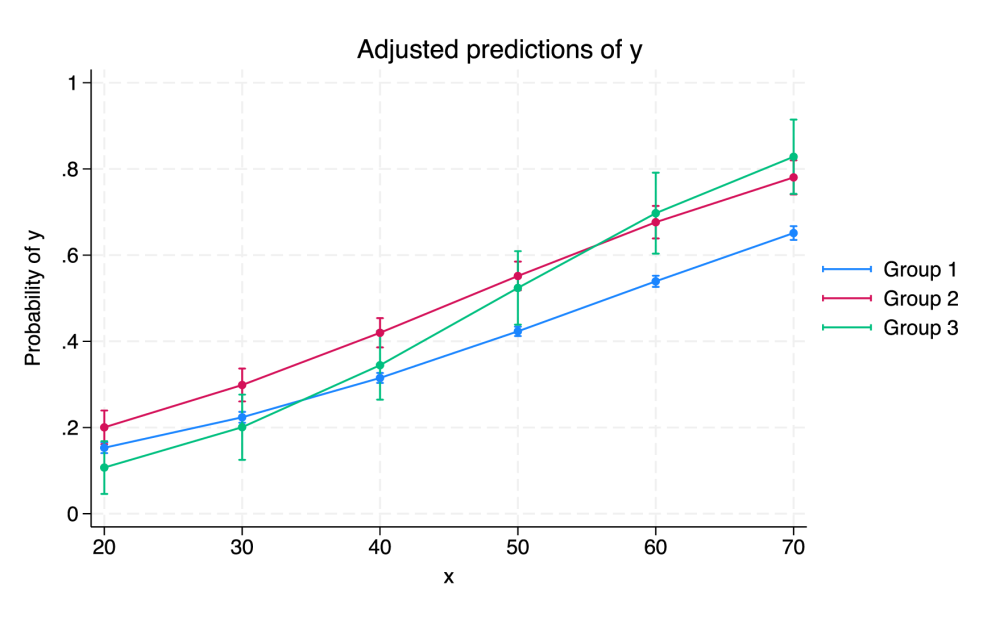
All-new graph style
White background, Horizontal y-axis labels, Bright color palette, Side legend, And more
You can also graph colors by variable
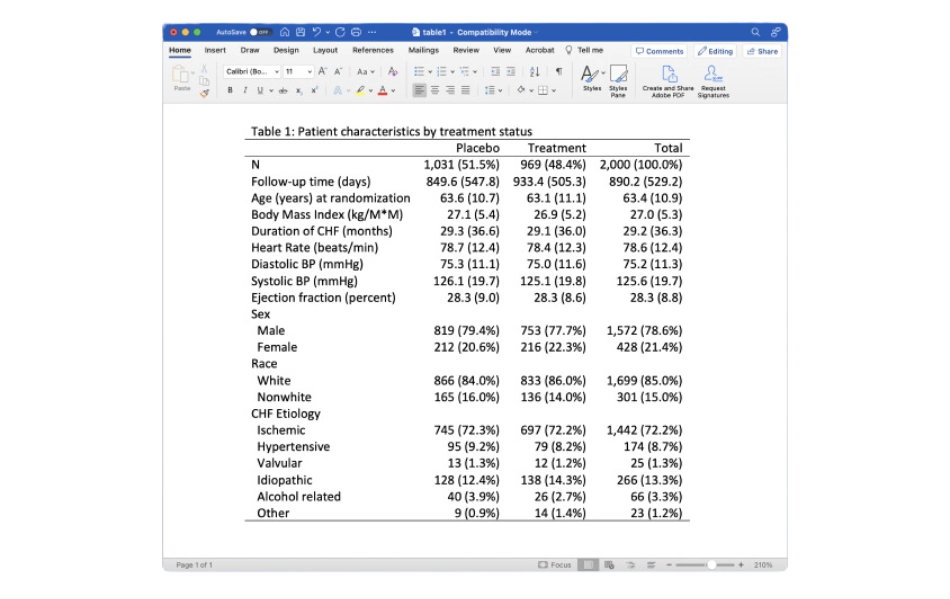
Table 1
Create tables of descriptive statistics more easily with the new dtable command!
Export to Word, Excel, PDF, LaTeX, HTML, Markdown, and more.
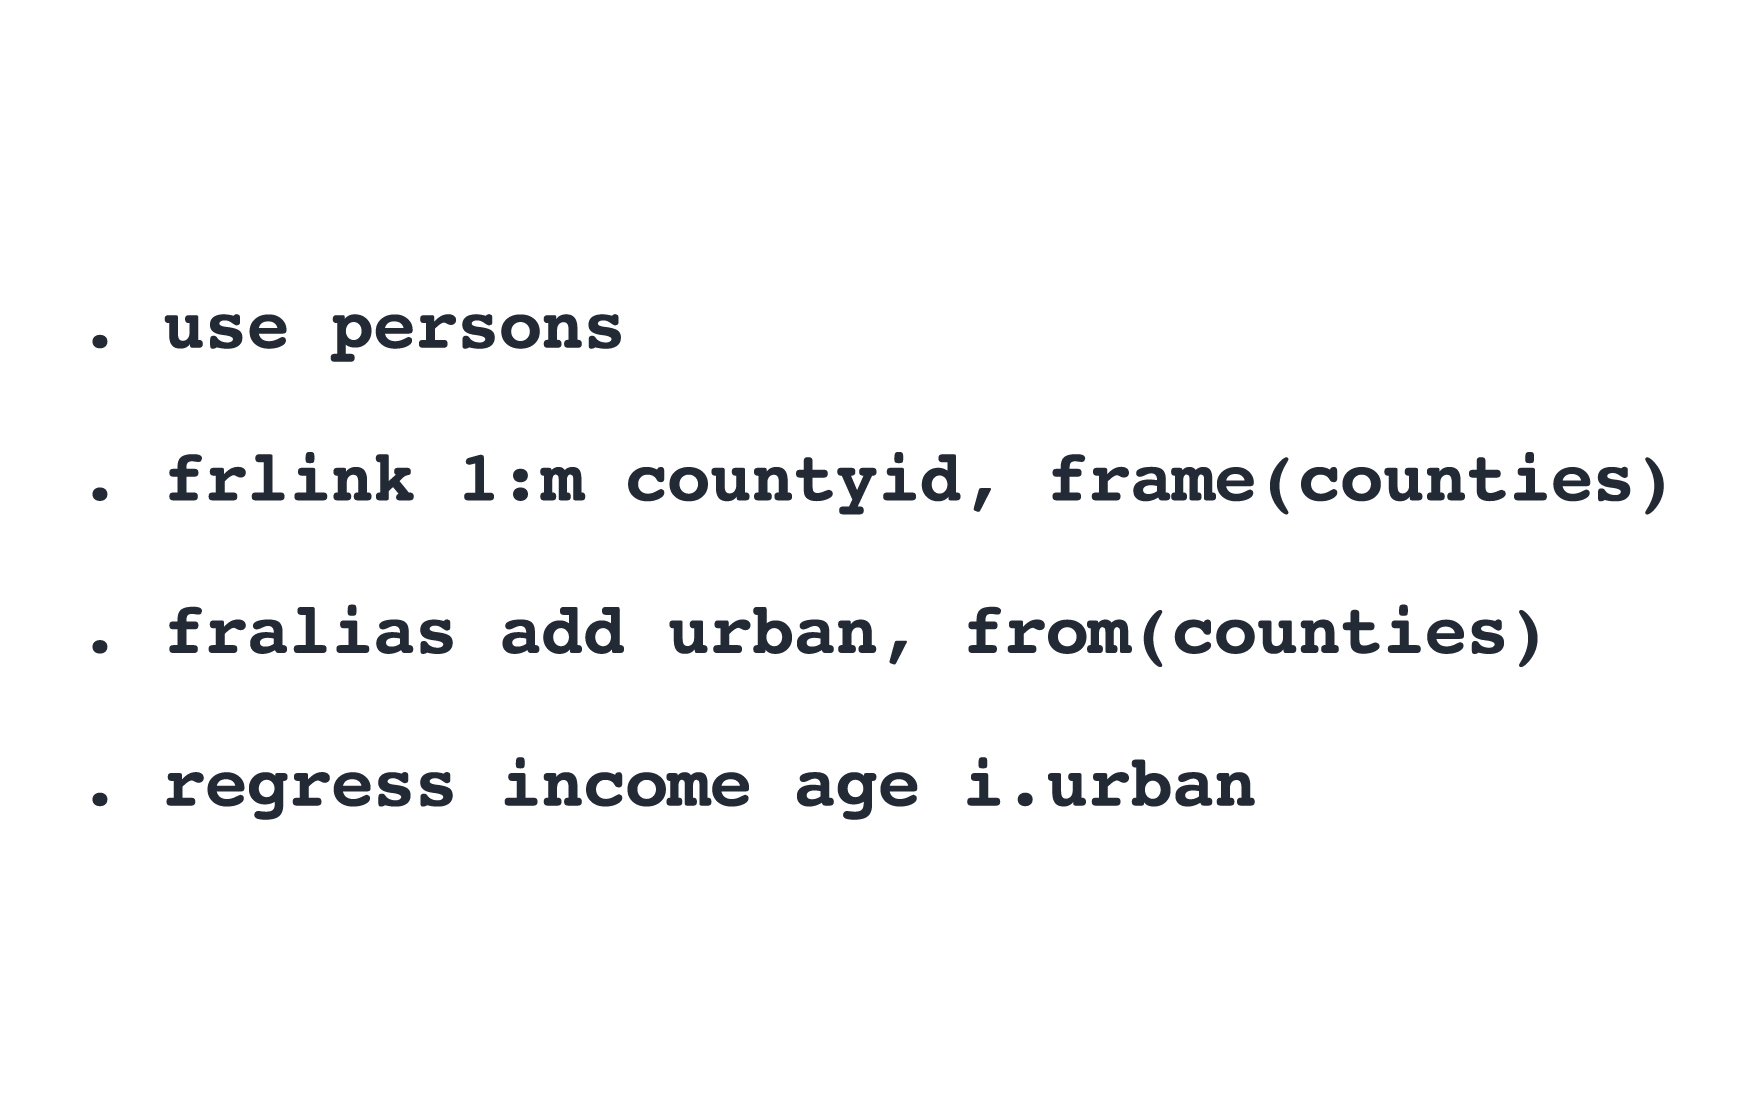
Alias variables across frames
Use variables from multiple datasets as if they exist in one.
And you can now work with frame sets.
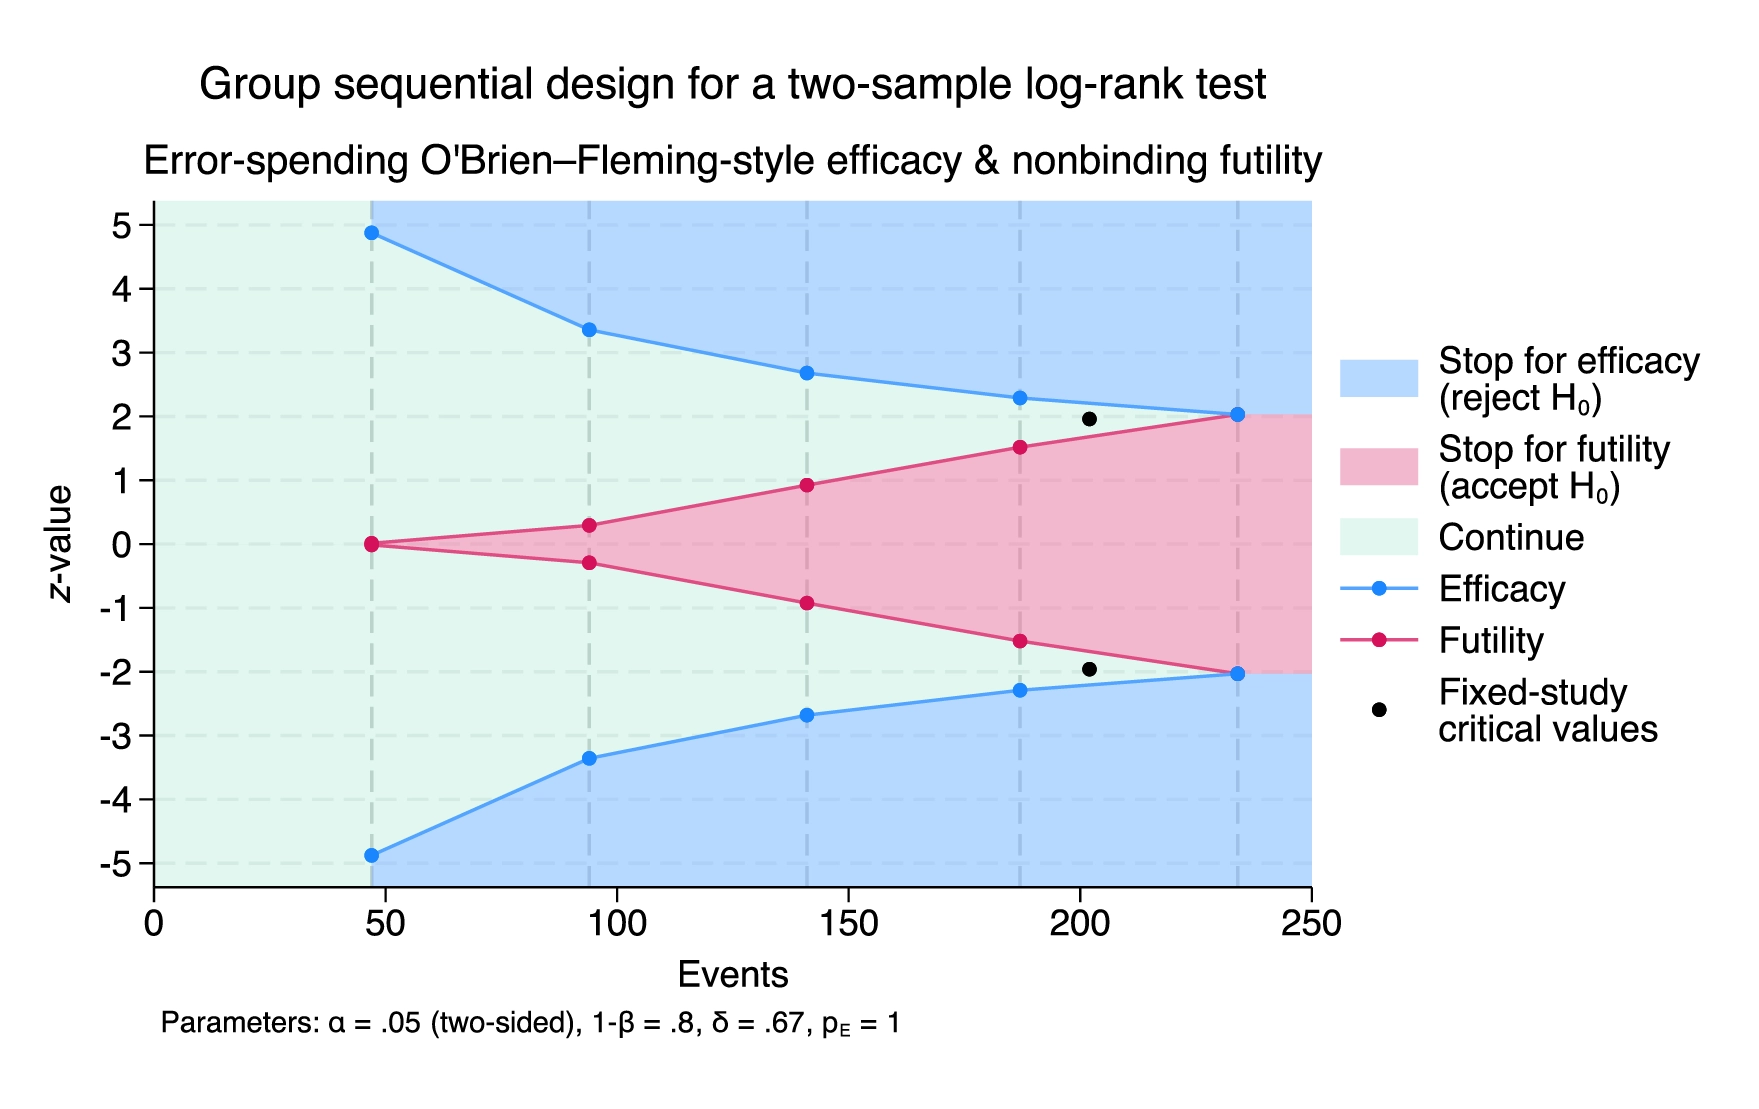
Group sequential designs
Calculate efficacy and futility stopping bounds for clinical trials.
Find required sample sizes for interim and final analyses when testing proportions, means, or survivor functions.
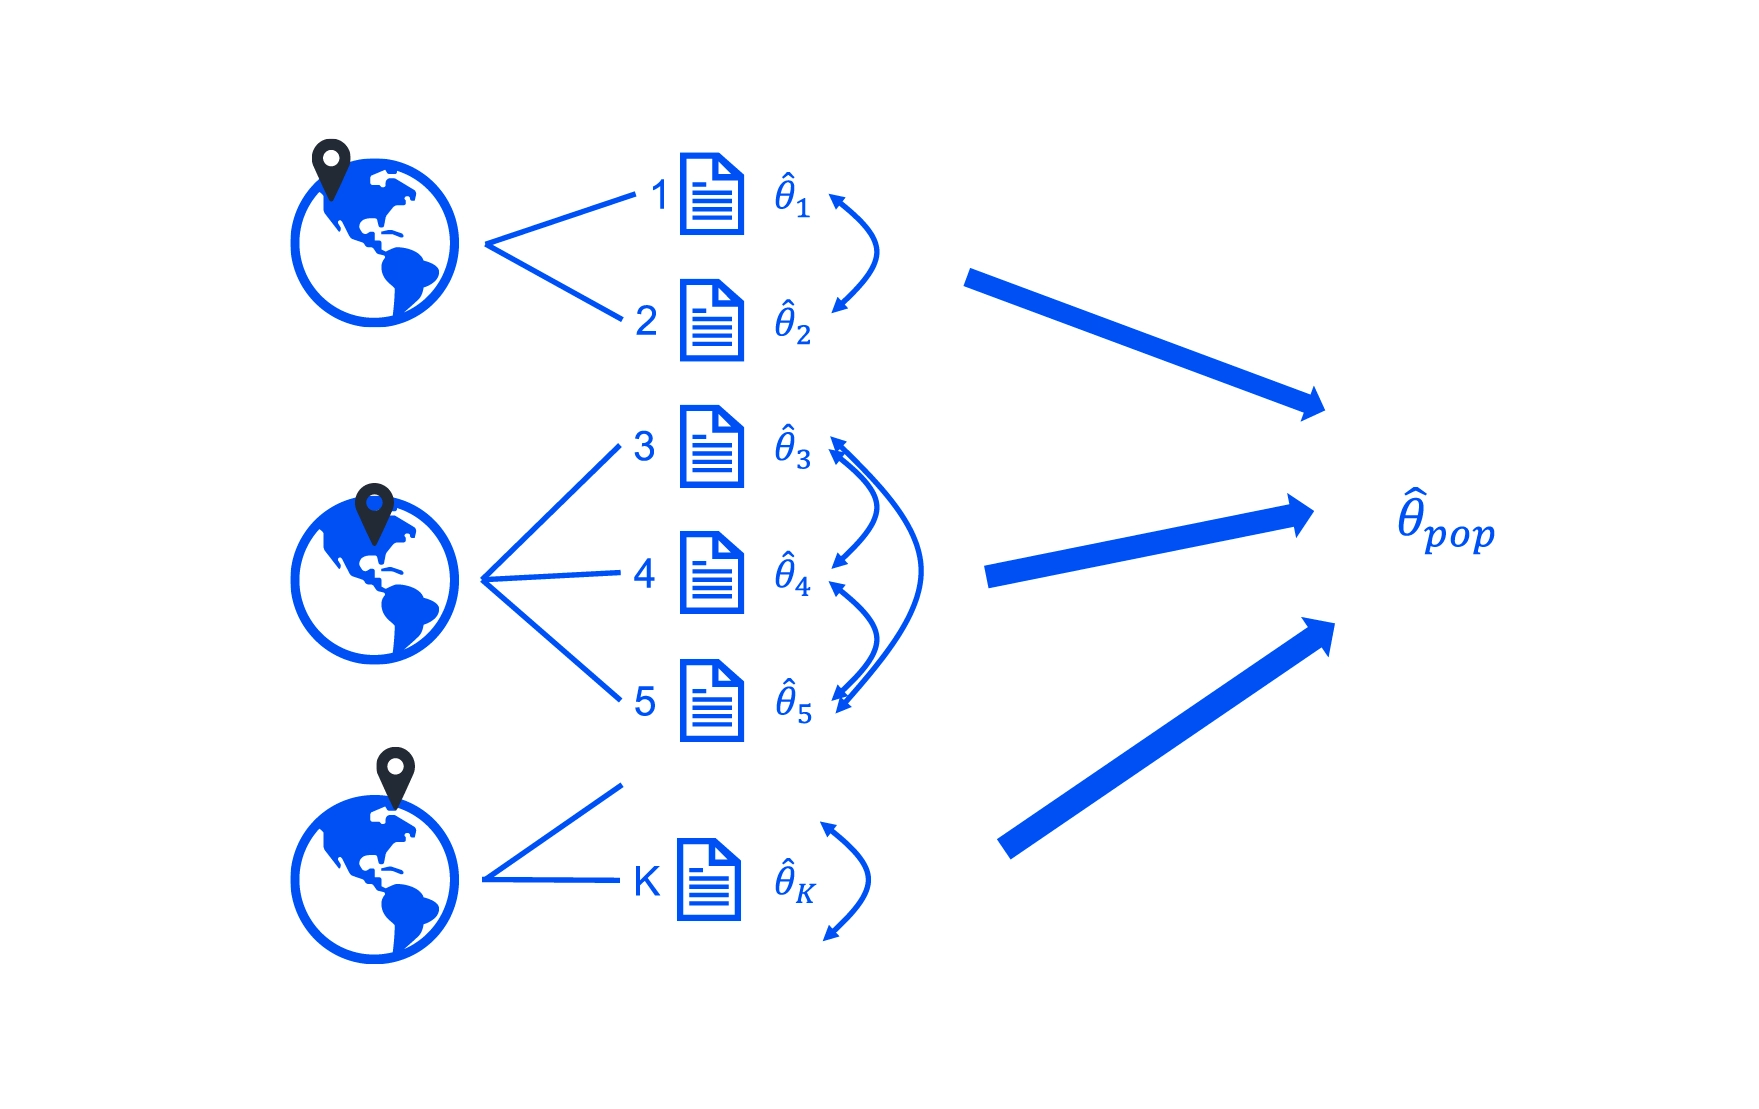
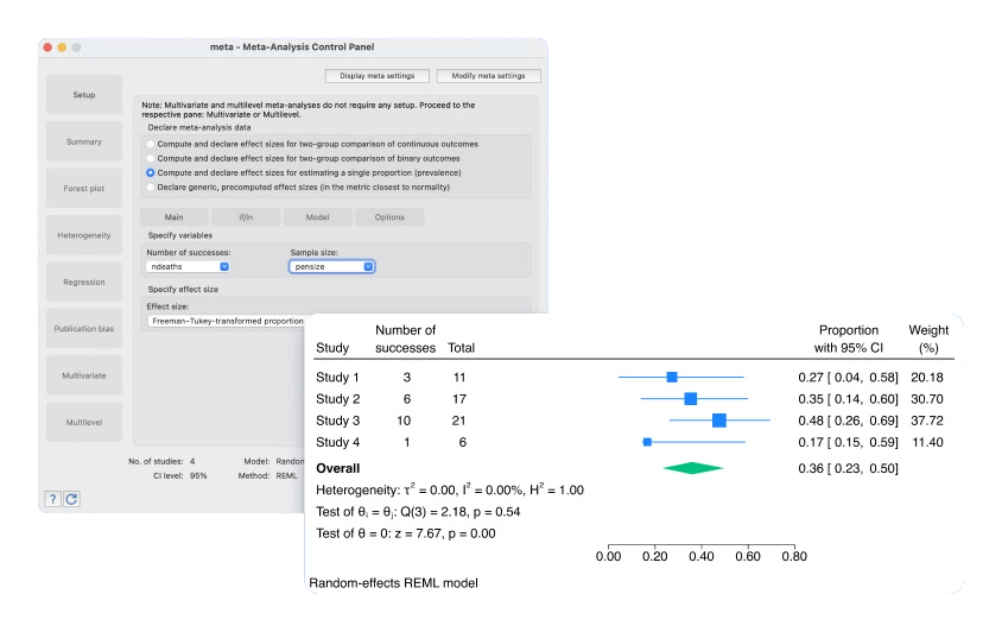
Multilevel meta-analysis
Do your studies have effect sizes nested within multiple grouping levels? Use multilevel meta-analysis to account for possible dependence among the effect sizes when combining results.
Alias variables across frames
Use variables from multiple datasets as if they exist in one.
And you can now work with frame sets.
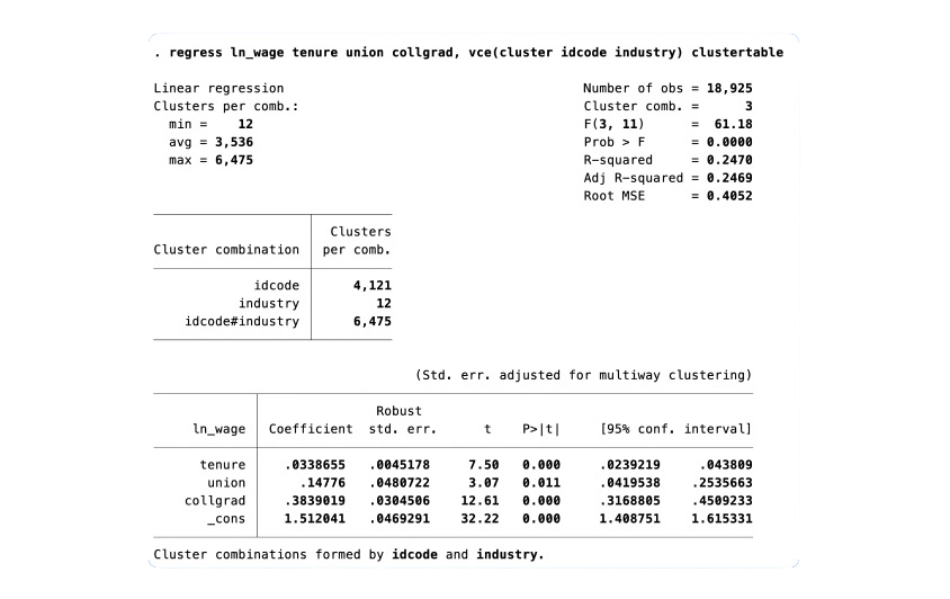
Robust inference for linear models
Stata's robust features for linear models became even more robust. Learn how.
Wild cluster bootstrap
Small number of clusters? Unequal observations per cluster? No problem! Wild cluster bootstrap handles them all.
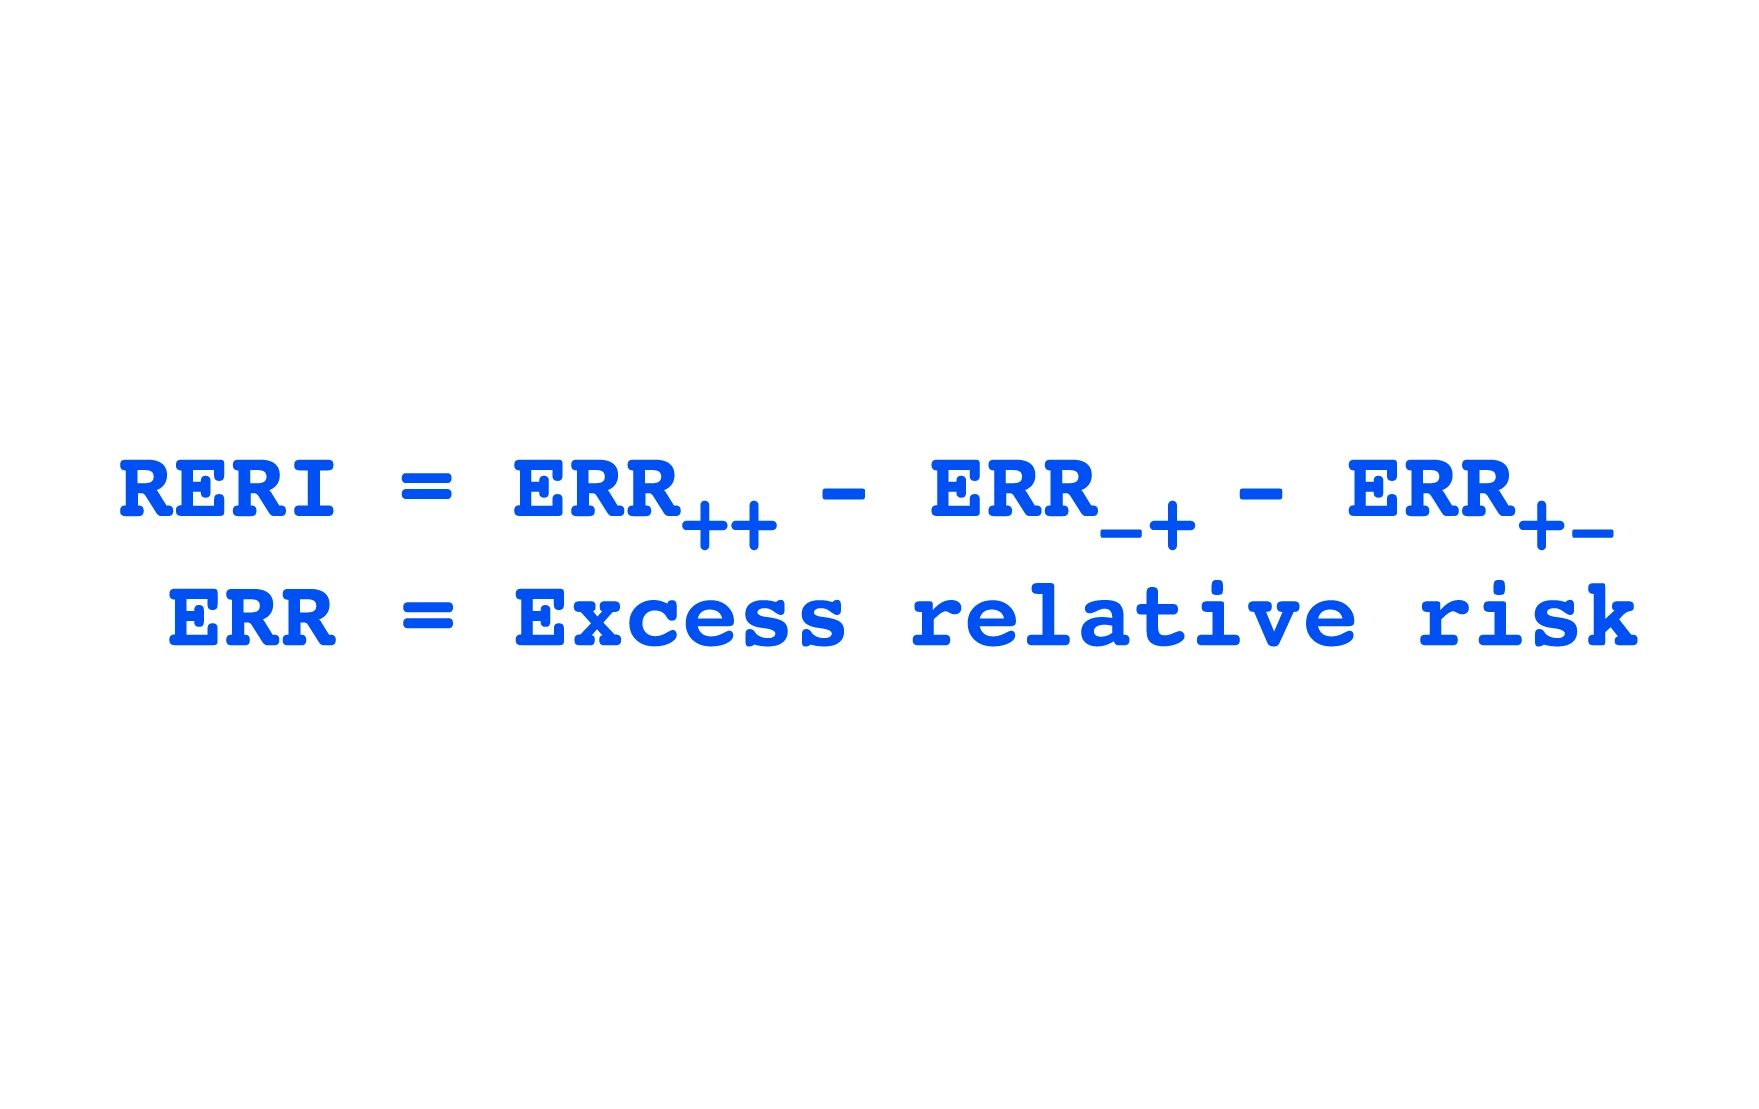
RERI
How do exposures interact to increase risk?
Use reri to find out.
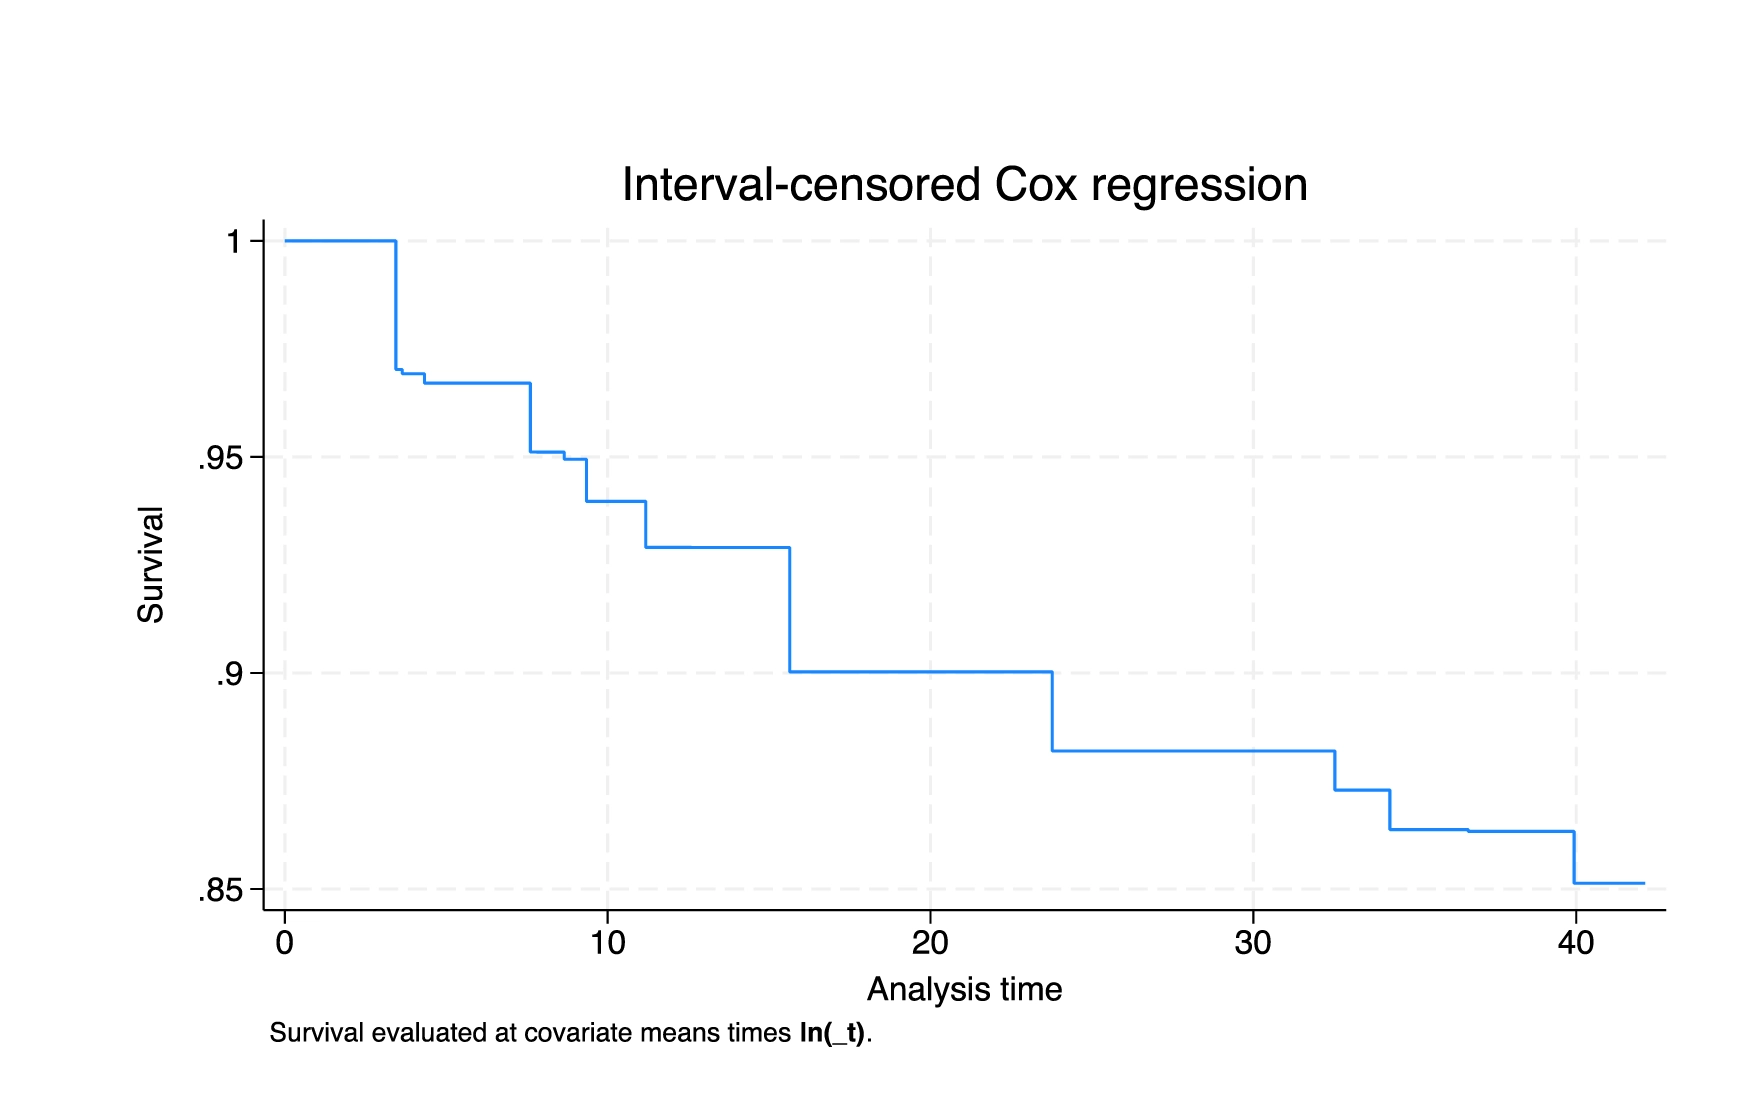
TVCs with interval-censored Cox model
Incorporate time-varying covariates in your interval-censored Cox analysis, including prediction and plots of survivor and other functions!
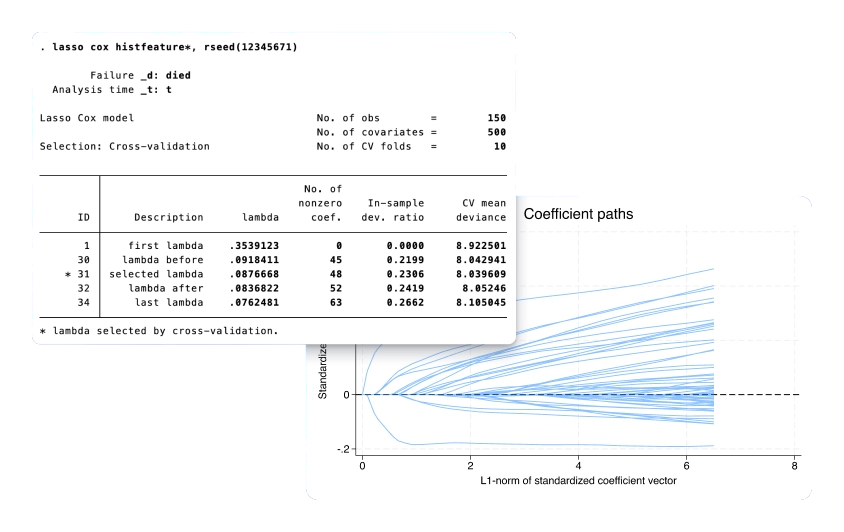
Lasso for Cox model
Select variables in a Cox model using lasso and elastic net.
Compute predictions. Graph survivor, failure, and other functions.
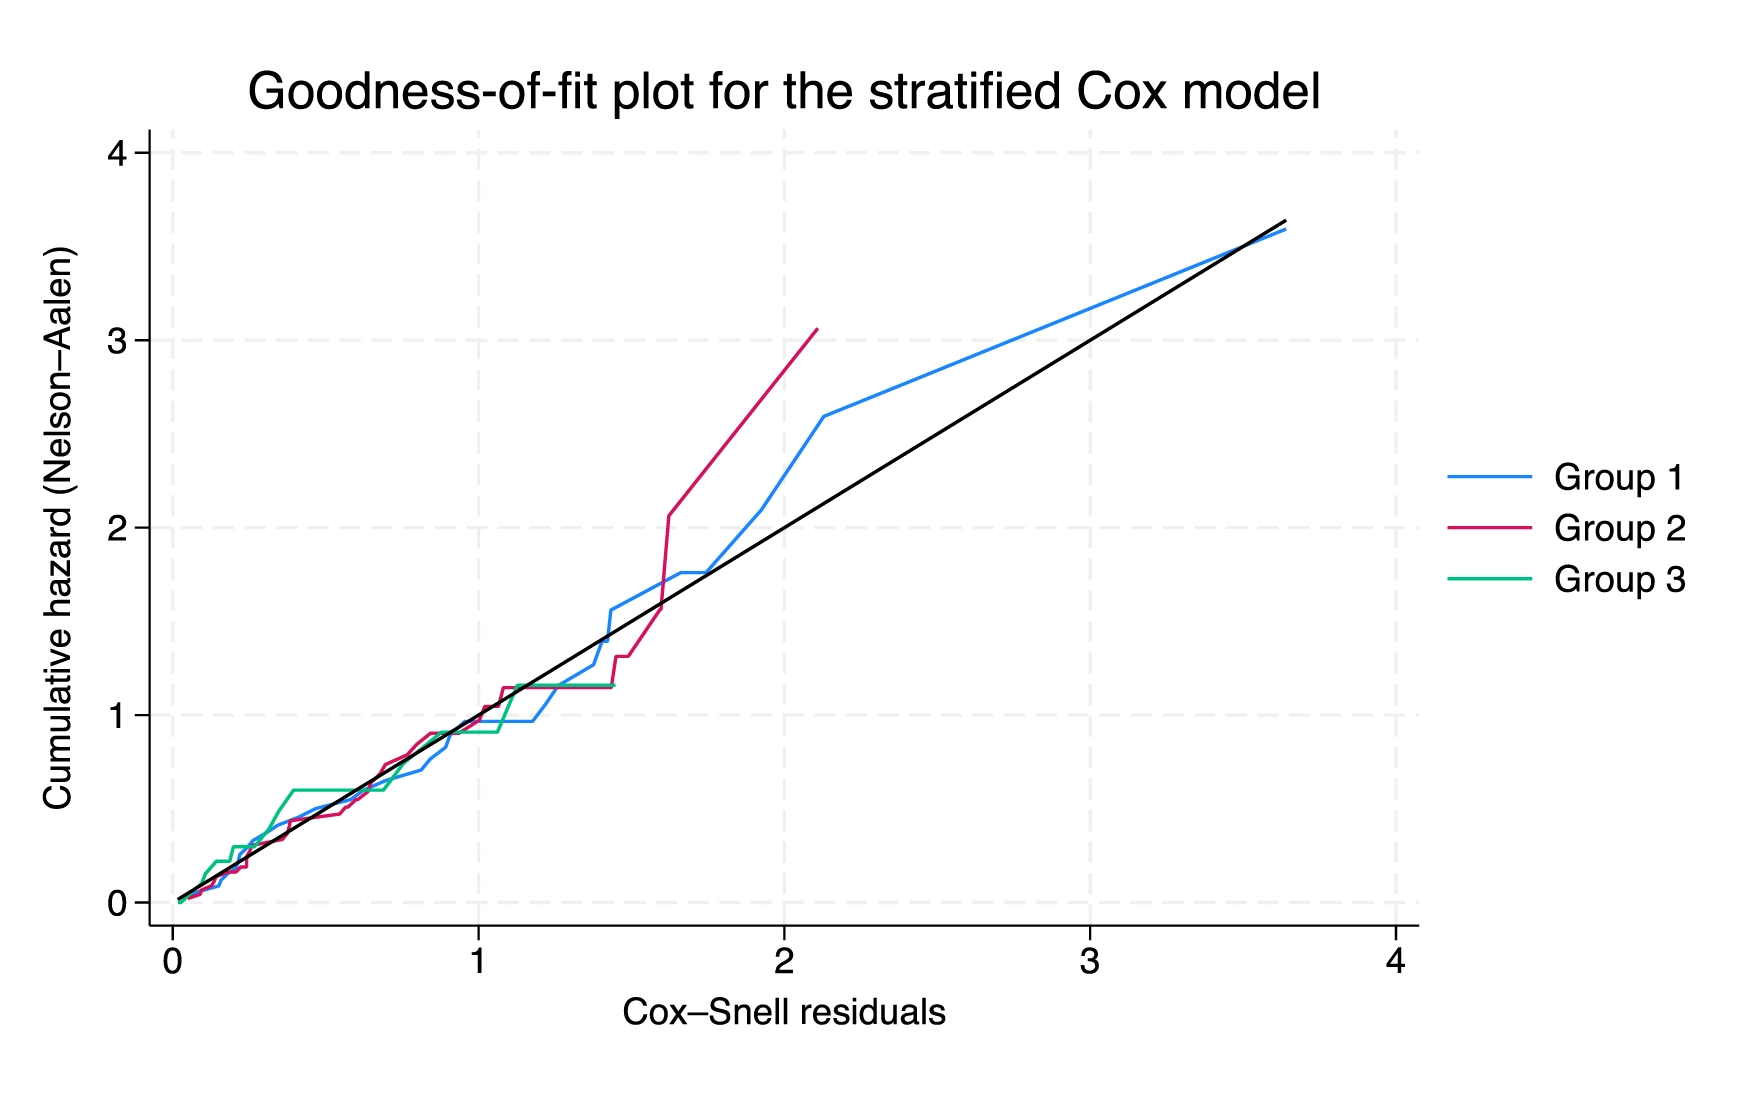
GOF plots for survival models
Want to know whether your survival model fits your data well? estat gofplot makes this easy. Use it with right-censored and interval-censored data, parametric and semiparametric models, and more.
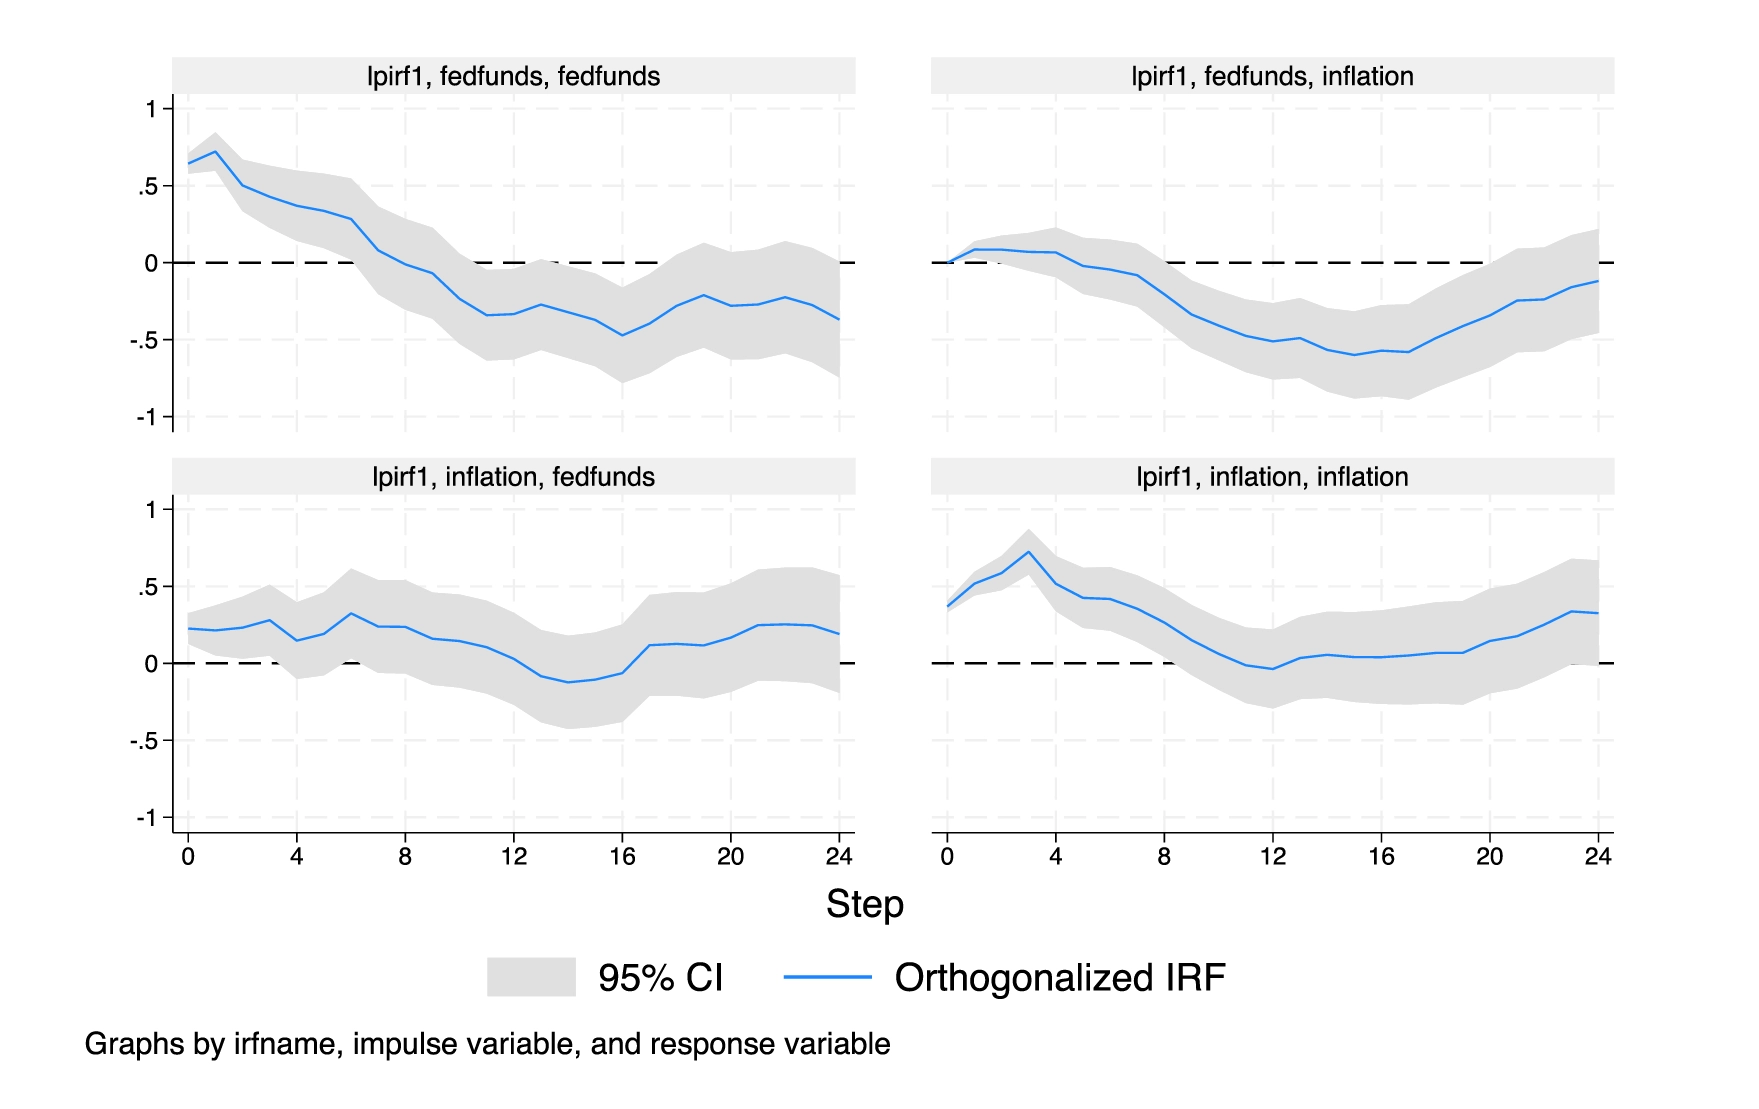
Local projections for IRFs
Estimate impulse–response functions (IRFs) via local projections. Test hypotheses of multiple IRF coefficients. Graph IRFs, orthogonalized IRFs, and dynamic multipliers.
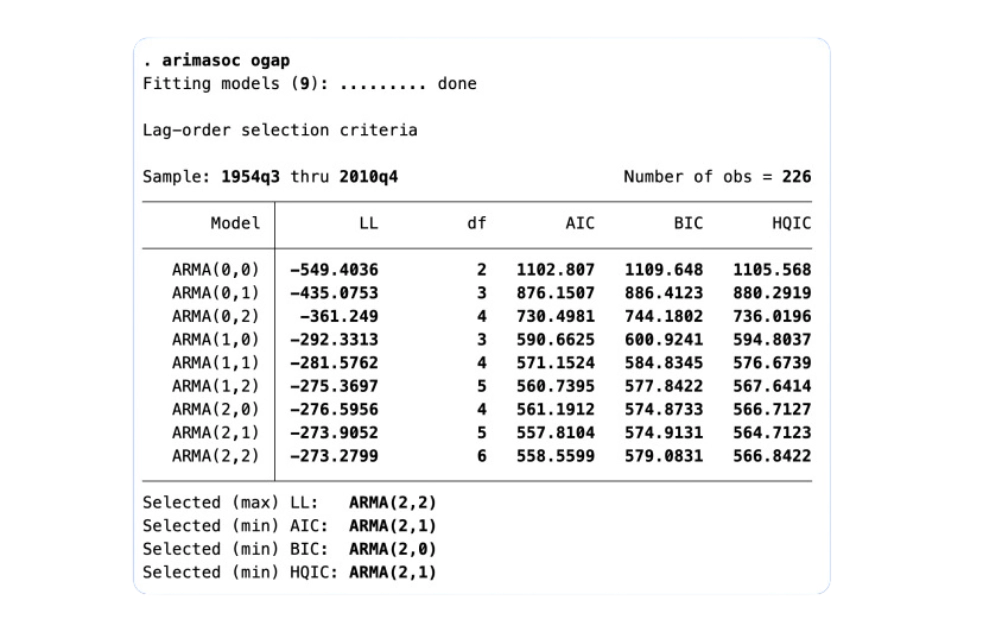
ARIMA and ARFIMA model selection
Compare potential ARIMA or ARFIMA models using AIC, BIC, and HQIC. Select the best number of autoregressive and moving-average terms.
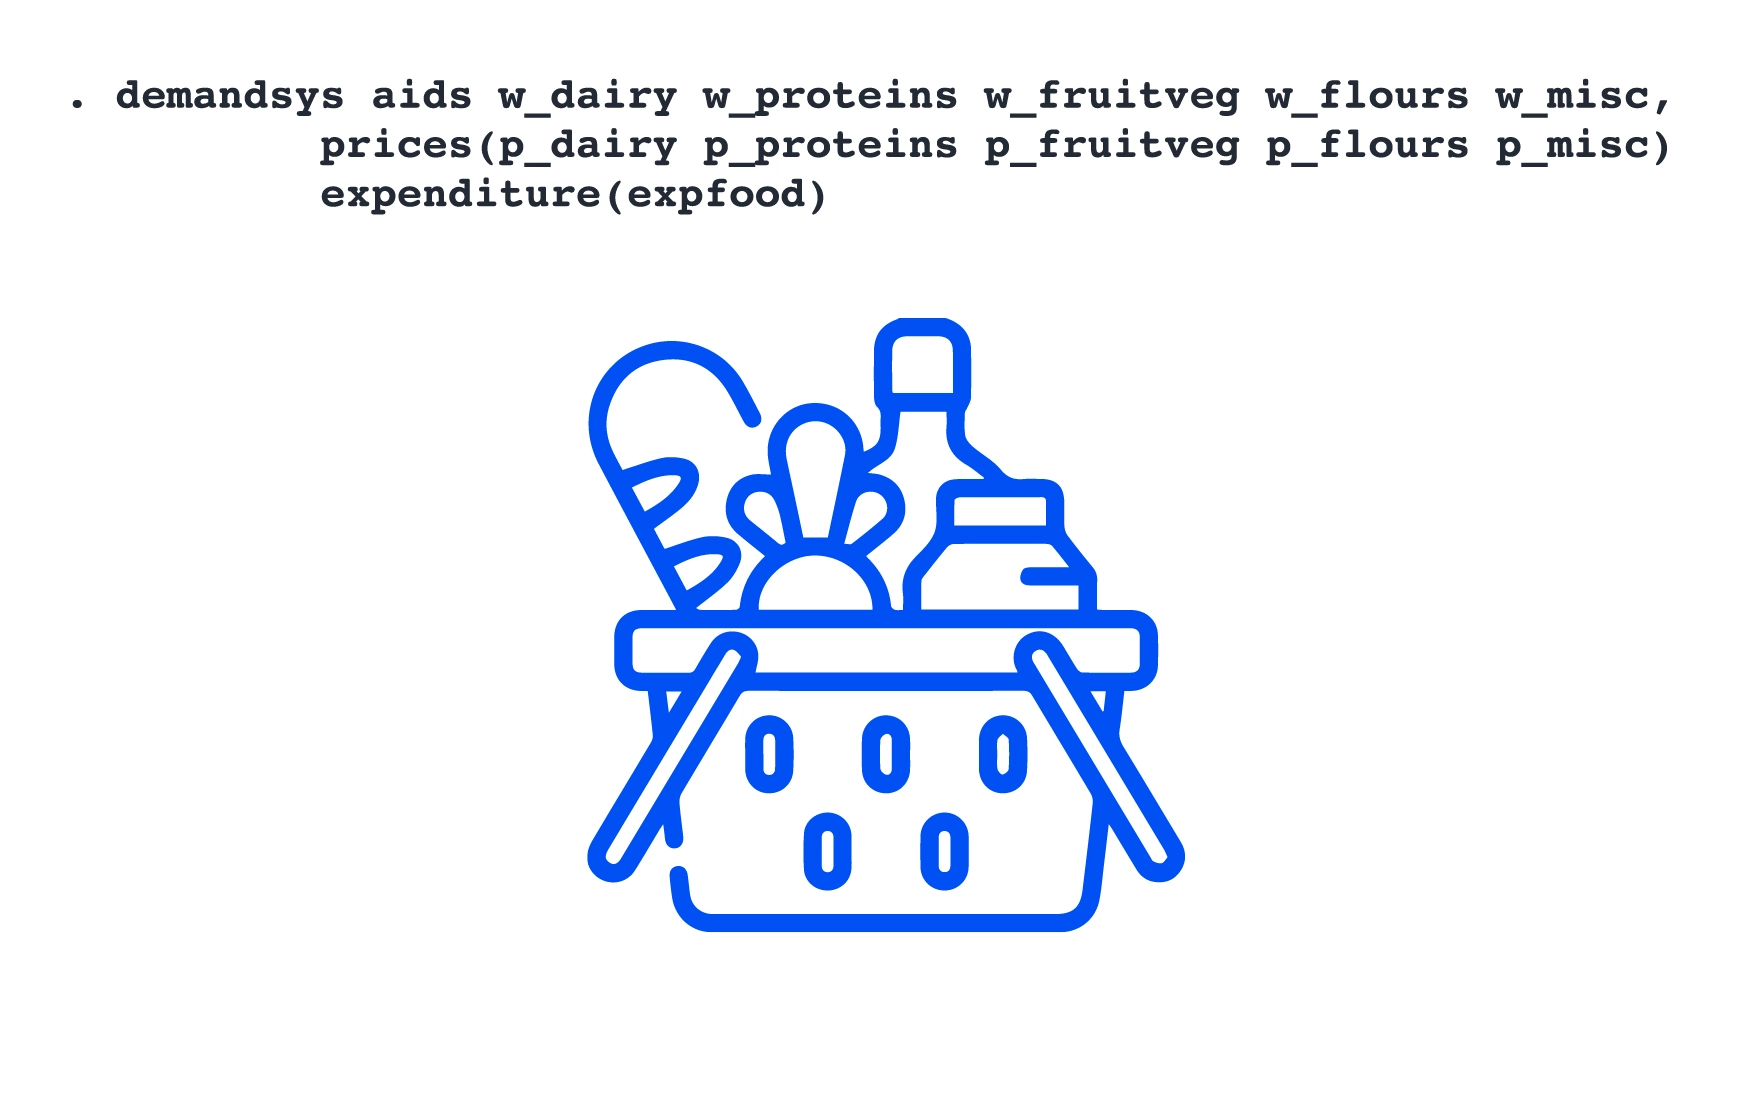
Flexible demand systems
Estimate demand for a basket of goods. Evaluate sensitivity to price and expenditure changes. Choose from eight demand systems, including Cobb–Douglas, translog, AIDS, and QUAIDS.
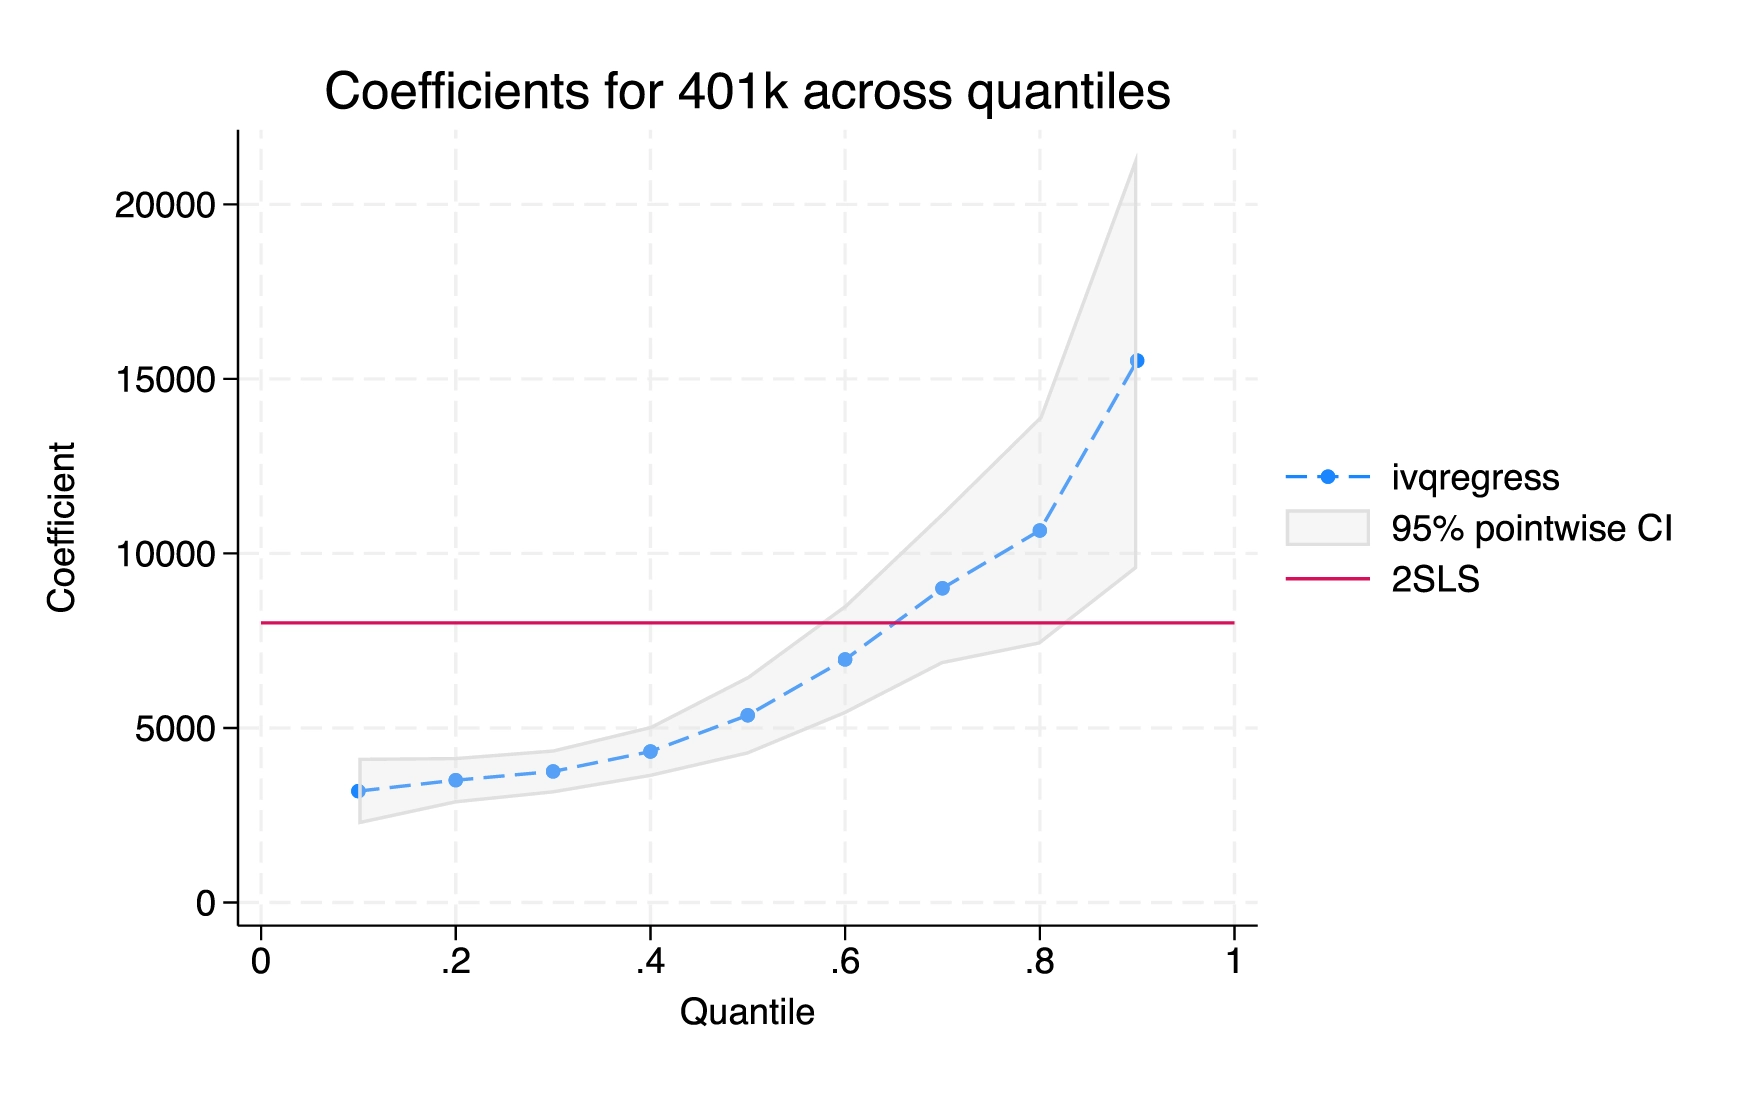
IV quantile regression
Estimate effects of covariates on quantiles of the outcome's conditional distribution. Account for endogeneity. Plot coefficients across quantiles.
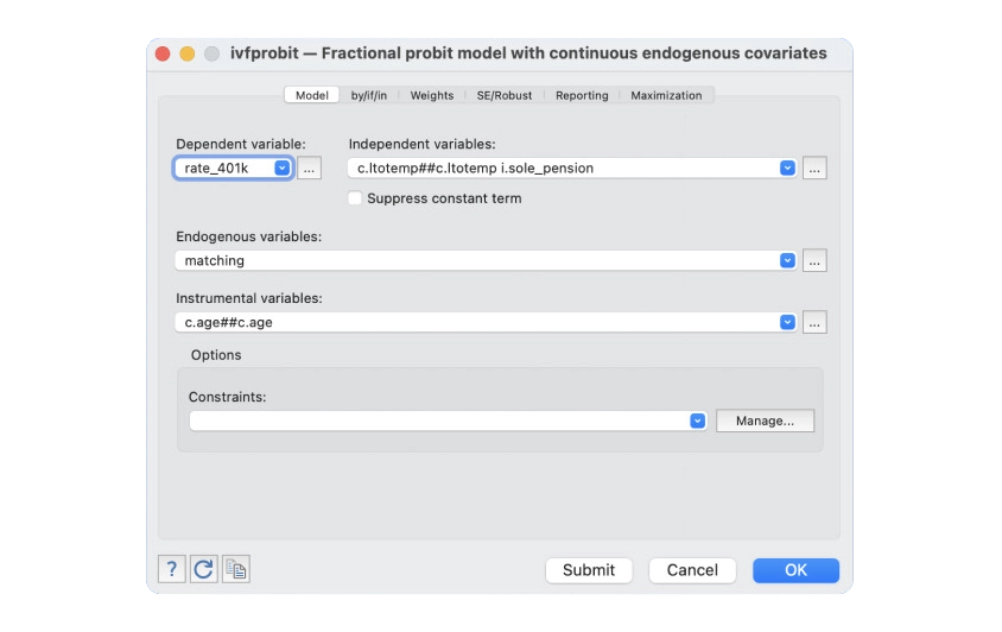
IV fractional probit model
Modeling a proportion or rate
Have endogenous covariates?
Fit your model with ivfprobit.
Interface enhancements
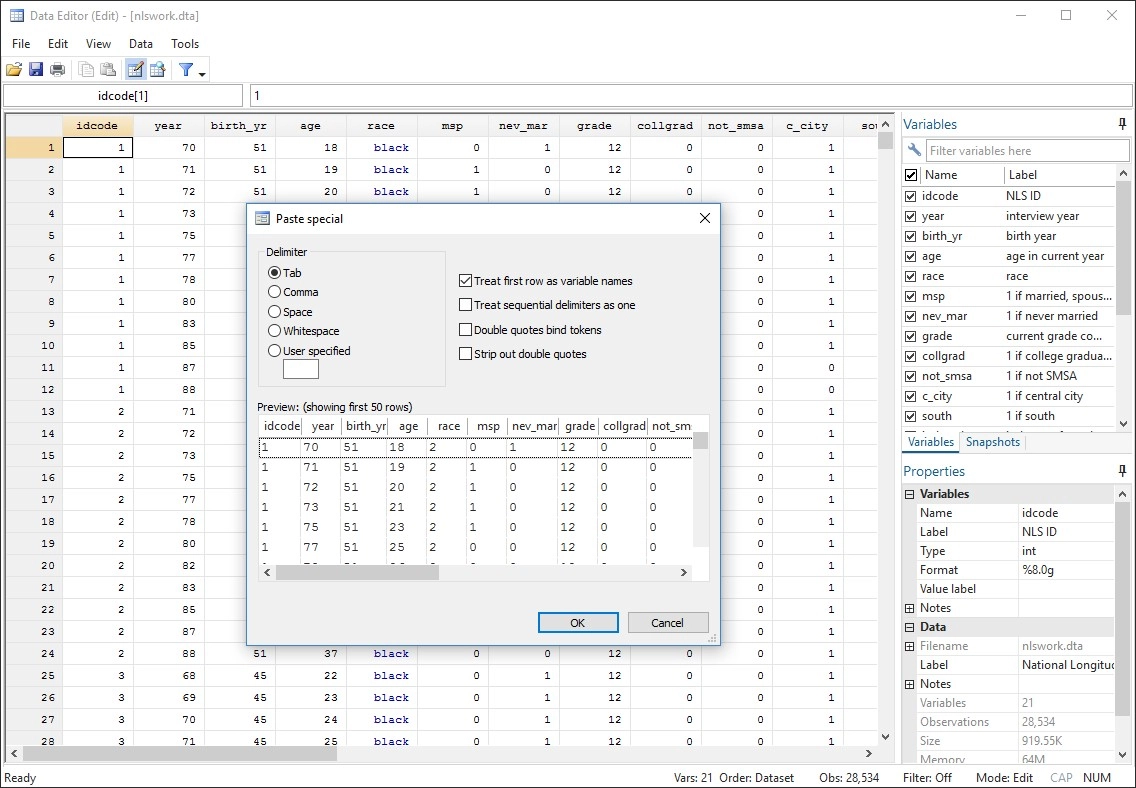
Data Editor—Pinnable rows and columns, tooltips for truncated text, variable labels in headers, much more.
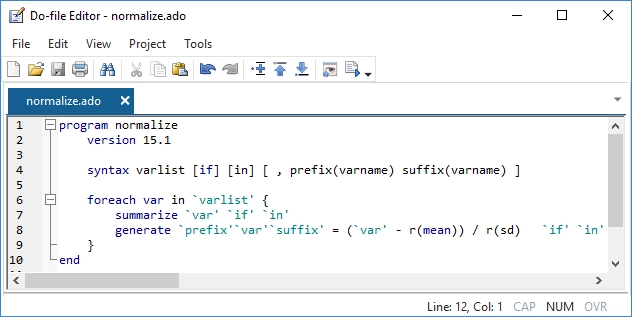
Do-file Editor—Automatic backups and syntax highlighting for user-defined keywords.
System Requirements
| OS | Windows 10 Macs avec Apple Silicon et macOS 10.13 ou plus récent pour Macs avec processeurs Intel |
|---|---|
| Processor | Apple Silicon, Intel or AMD Processor (Core i3 or higher) |
| Memory | Stata/MP > 4GB, Stata/SE > 2GB, and Stata/BE 1GB |
| Hard Drive | 4GB |
| Graphics | ATI Radeon 8500 or Nvidia GeForce 4 or higher video card |
Why Stata?
You can point and click to create a custom graph. Or you can write scripts to produce hundreds or thousands of graphs
in a reproducible manner. Export graphs to EPS or TIFF for publication, to PNG or SVG for the web, or to PDF for viewing.
With the integrated Graph Editor, you click to change anything about your graph or to add titles, notes, lines, arrows, and text.
You can point and click to create a custom graph. Or you can write scripts to produce hundreds or thousands of graphs in a reproducible manner. Export graphs to EPS or TIFF for publication, to PNG or SVG for the web, or to PDF for viewing. With the integrated Graph Editor, you click to change anything about your graph or to add titles, notes, lines, arrows, and text.
|
|
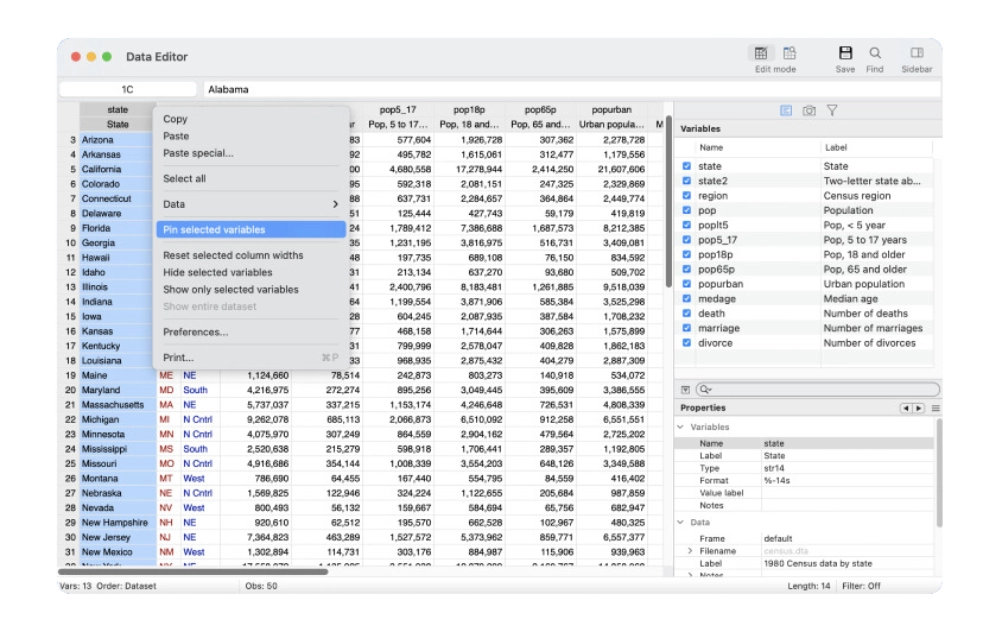
Master your Data
Stata's data management features give you complete control.
|
|
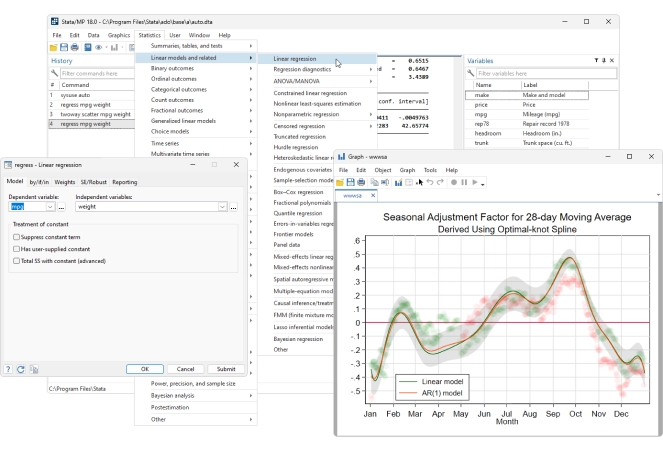
Publication Quality Graphs
Stata makes it easy to generate publication-quality, distinctly styled graphs.
You can point and click to create a custom graph. Or you can write scripts to produce hundreds or thousands of graphs
in a reproducible manner.
Export graphs to EPS or TIFF for publication, to PNG or SVG for the web, or to PDF for viewing.
With the integrated Graph Editor, you click to change anything about your graph or to add titles, notes, lines, arrows, and text.
Automated Reporting
All the tools you need to automate reporting your results.
- Dynamic Markdown document
- Create Word documents
- Create PDF documents
- Create Excel files
- Customizable tables
- Schemes for graphics
- Word, HTML, PDF, SVG, PNG
Truly Reproducible Research
Lots of folks talk about reproducible research. Stata has been dedicated to it for over 30 years.
We constantly add new features; we have even fundamentally changed language elements. No matter. Stata is the only statistical package with integrated versioning. If you wrote a script to perform an analysis in 1985, that same script will still run and still produce the same results today. Any dataset you created in 1985, you can read today. And the same will be true in 2050. Stata will be able to run anything you do today.
We take reproducibility seriously.
Real Documentation
When it comes time to perform your analyses or understand the methods you are using, Stata does not leave you high and dry or ordering books to learn every detail.
Each of our data management features is fully explained and documented and shown in practice on real examples. Each estimator is fully documented and includes several examples on real data, with real discussions of how to interpret the results. The examples give you the data so you can work along in Stata and even extend the analyses. We give you a Quick start for every feature, showing some of the most common uses. Want even more detail? Our Methods and formulas sections provide the specifics of what is being computed, and our References point you to even more information.
Stata is a big package and so has lots of documentation – over 18,000 pages in 35 manuals. But don't worry, type help my topic, and Stata will search its keywords, indexes, and even community-contributed packages to bring you everything you need to know about your topic. Everything is available right within Stata.
Trusted
We don't just program statistical methods, we validate them.
The results you see from a Stata estimator rest on comparisons with other estimators, Monte Carlo simulations of consistency and coverage, and extensive testing by our statisticians. Every Stata we ship has passed a certification suite that includes 4.1 million lines of testing code that produces 5.8 million lines of output. We certify every number and piece of text from those 5.8 million lines of output.
Continuously Updated
Staying on the most up-to-date version of Stata is now easier than ever.
StataCorp continually develops new features to enhance Stata software, from the latest statistical methods to the best in reporting, data visualization, and user interface. With StataNow™, new features are released throughout the current release until the next major release. These features are prioritized in the development cycle to be available as soon as they are ready so that users can take advantage of them right away.
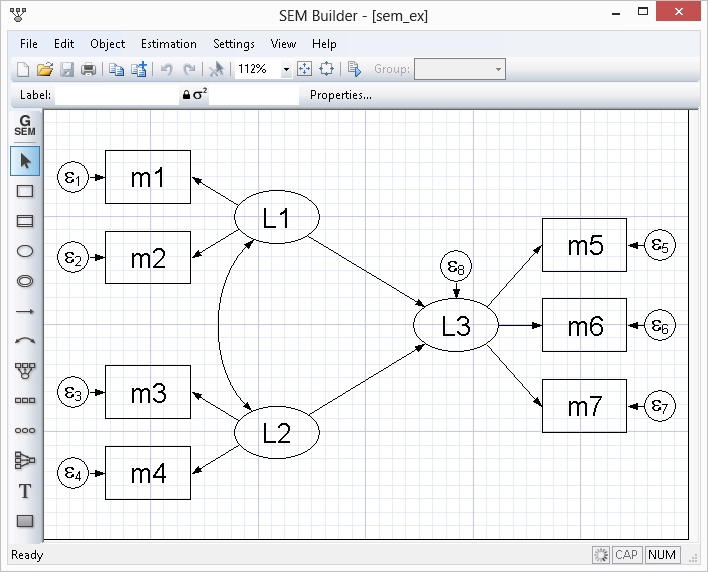
Easy to Use
Staying on the most up-to-date version of Stata is now easier than ever.
All of Stata's features can be accessed through menus, dialogs, control panels, a Data Editor, a Variables Manager, a Graph Editor, and even an SEM Diagram Builder. You can point and click your way through any analysis.
If you don't want to write commands and scripts, you don't have to.
Even when you are pointing and clicking, you can record all your results and later include them in reports. You can even save the commands created by your actions and reproduce your complete analysis later.
Easy to Grow with
Stata's commands for performing tasks are intuitive and easy to learn. Even better, everything you learn about performing a task can be applied to other tasks. For example, you simply add if gender=="female" to any command to limit your analysis to females in your sample. You simply add vce(robust) to any estimator to obtain standard errors and hypothesis tests that are robust to many common assumptions.
The consistency goes even deeper. What you learn about data management commands often applies to estimation commands, and vice-versa. There is also a full suite of postestimation commands to perform hypothesis tests, form linear and nonlinear combinations, make predictions, form contrasts, and even perform marginal analysis with interaction plots. These commands work the same way after virtually every estimator.
Sequencing commands to read and clean data, then to perform statistical tests and estimation, and finally to report results is at the heart of reproducible research. Stata makes this process accessible to all researchers.
Easy to Automate
Everyone has tasks that they do all the time—create a particular kind of variable, produce a particular table, perform a sequence of statistical steps, compute an RMSE, etc. The possibilities are endless. Stata has thousands of built-in procedures, but you may have tasks that are relatively unique or that you want done in a specific way.
If you have written a script to perform your task on a given dataset, it is easy to transform that script into something that can be used on all your datasets, on any set of variables, and on any set of observations.
Easy to extend
Some of the things you automate may be so useful that you want to share them with colleagues or even make them available to all Stata users. That's also easy. With just a little code, you can turn an automation script into a Stata command. A command that supports standard features that Stata's official commands support. A command that can be used in the same way official commands are used.
Advanced Programming
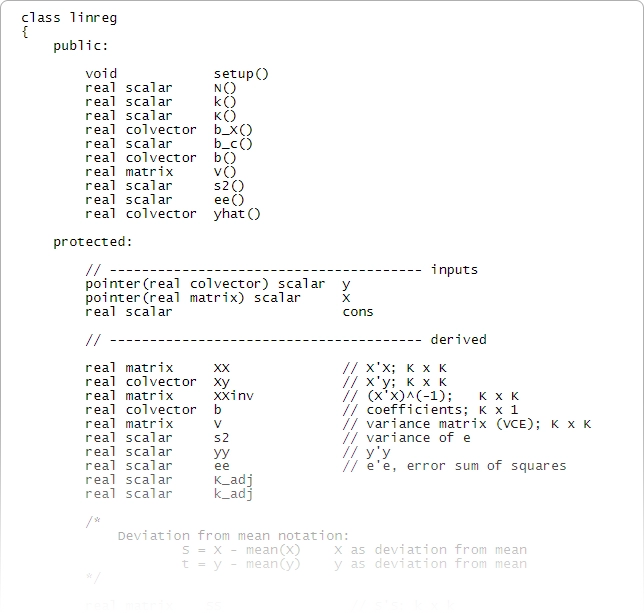
Stata also includes an advanced programming language—Mata.
Mata has the structures, pointers, and classes that you expect in your programming language and adds direct support for matrix programming.
Though you don't need to program to use Stata, it is comforting to know that a fast and complete programming language is an integral part of Stata. Mata is both an interactive environment for manipulating matrices and a full development environment that can produce compiled and optimized code. It includes special features for processing panel data, performs operations on real or complex matrices, provides complete support for object-oriented programming, and is fully integrated with every aspect of Stata. Stata also has comprehensive Python integration, allowing you to harness all the power of Python directly from your Stata code.
Stata also has PyStata, which provides comprehensive Python integration, allowing you to harness all the power of Python directly from your Stata code and to harness all the power of Stata from your Python code.
Stata even let's you incorporate C, C++, and Java plugins in your Stata programs via a native API for each language. And you can even embed Java code directly in your Stata code!
Community-contributed features
Stata is so programmable that developers and users add new features every day to respond to the growing demands of today's researchers.
With Stata's Internet capabilities, new features and official updates can be installed over the Internet with a single click.
World-class technical support
All registered users of the current release of Stata (Stata 18) are eligible for free technical support. If you have not registered your copy of Stata, please fill out the online registration form.
We have a dedicated staff of expert Stata programmers and statisticians to answer your technical questions. From tricky data management solutions to getting your graph looking just right and from explaining a robust standard error to specifying your multilevel model, we have your answers.
Cross-platform compatible
Stata will run on Windows, Mac, and Linux/Unix computers; however, our licenses are not platform specific. That means if you have a Mac laptop and a Windows desktop, you don't need two separate licenses to run Stata. You can install your Stata license on any of the supported platforms. Stata datasets, programs, and other data can be shared across platforms without translation. You can also quickly and easily import datasets from other statistical packages, spreadsheets, and databases.
The Bulletin
-
More
-
 More
MoreGreenflation or Transformation? Unpacking Energy Prices in the Transition Era
-
 More
MoreIs the World Heading for a Soft Landing in 2026?
-
 More
MoreA Generation at Risk: The Realities of Youth Unemployment in Europe and the UK
-
 More
MoreRebuilding Economies After Natural Disasters: What Does The Data Say?
-
 More
MoreAI’s Hidden Cost: The Unanswered Question of Energy Consumption